Introduction:
AutoCAD, an industry-leading software in the realm of computer-aided design (CAD), continually evolves to provide architects, engineers, and designers with tools that enhance efficiency and creativity. Among the myriad features that contribute to a seamless design experience, AutoCAD’s drag and drop features stand out as powerful functionalities that simplify various tasks within the software. This extensive article delves into the intricacies of AutoCAD’s drag and drop features, exploring their functionalities, applications, and the transformative impact they have on achieving a fluid and intuitive design workflow.
Understanding AutoCAD’s Drag and Drop Features:
AutoCAD’s drag and drop features empower users to perform actions such as inserting blocks, applying hatch patterns, and even reordering layers through a simple click-and-drag mechanism. These features eliminate the need for manual commands and provide an intuitive and visually interactive method for manipulating elements within the drawing space.
Key Features and Functionalities:
- Inserting Blocks:
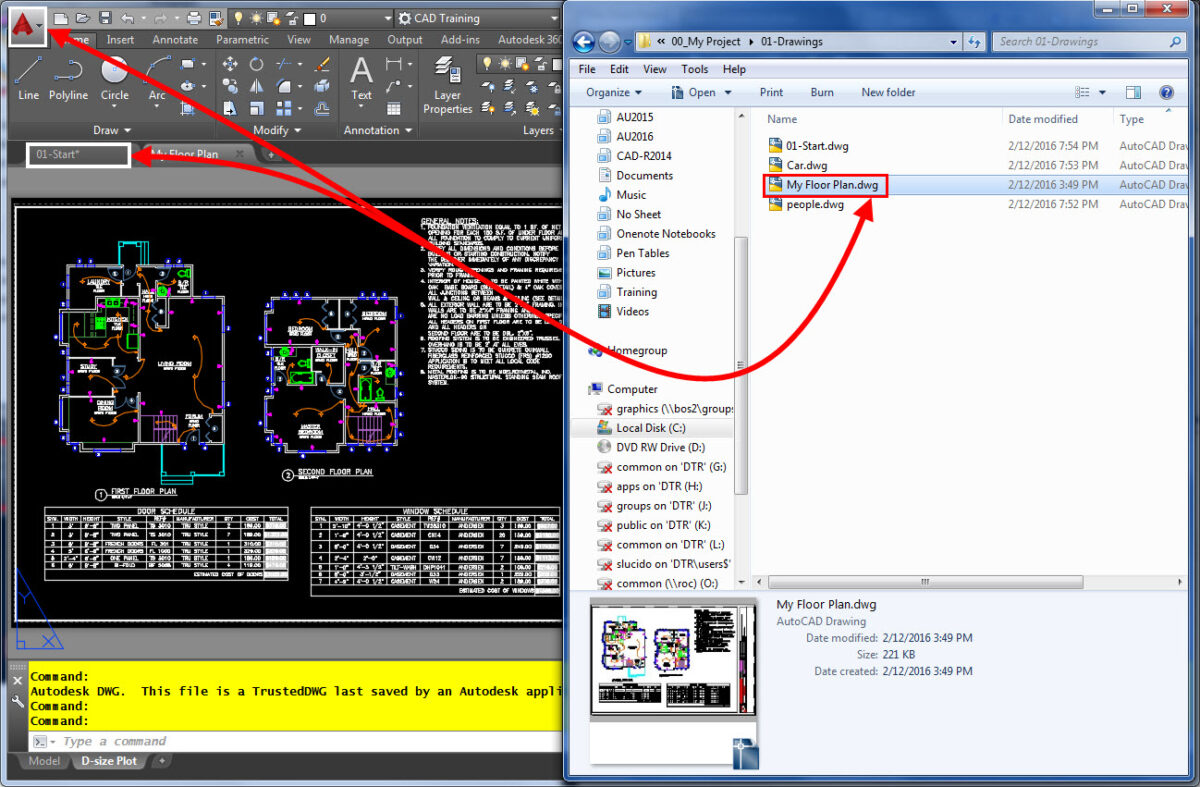
- The primary function of the drag and drop feature in AutoCAD is to facilitate the insertion of blocks.
- Designers can drag blocks directly from the tool palette or external libraries and drop them into the drawing area, streamlining the block insertion process.
- Applying Hatch Patterns:
- AutoCAD’s drag and drop functionality extends to the application of hatch patterns.
- Designers can select a hatch pattern from the hatch pattern palette and drag it onto a closed boundary in the drawing to quickly apply the pattern.
- Reordering Layers:
- The drag and drop feature is instrumental in reordering layers within the Layers Properties Manager.
- Designers can rearrange the order of layers by dragging them to the desired position, offering a visual and efficient method for managing layer hierarchy.
- Manipulating Viewports:
- AutoCAD’s layout viewports can also be adjusted using drag and drop.
- Designers can modify the size and position of viewports by dragging the viewport boundaries, providing real-time visual feedback.
Applications of AutoCAD’s Drag and Drop Features:
- Efficient Block Insertion:
- The drag and drop feature expedites the process of inserting frequently used blocks into drawings.
- Designers can build a library of commonly used blocks and efficiently insert them into different projects with a simple drag and drop action.
- Quick Application of Hatch Patterns:
- Applying hatch patterns becomes a swift and visual process with the drag and drop feature.
- Designers can experiment with different hatch patterns, dragging and dropping them onto specific areas to achieve the desired visual representation.
- Intuitive Layer Management:
- Reordering layers is a fundamental aspect of layer management in AutoCAD.
- The drag and drop feature simplifies this process, allowing designers to intuitively arrange layers to reflect the desired stacking order.
- Dynamic Viewport Adjustments:
- Manipulating viewports for layout compositions is made dynamic and interactive through drag and drop.
- Designers can easily resize or reposition viewports, gaining immediate visual feedback on the layout composition.
Optimizing Workflow with AutoCAD’s Drag and Drop Features:
- Mastering Block Libraries:
- Designers should create and organize comprehensive block libraries to fully leverage the drag and drop feature.
- This involves categorizing blocks based on type, project, or functionality for efficient insertion.
- Exploring Hatch Pattern Variations:
- AutoCAD provides a range of hatch patterns, and designers should explore different variations.
- Experimenting with drag and drop for hatch pattern application allows for quick visual assessments and adjustments.
- Utilizing Layer Management Tools:
- In addition to drag and drop, designers should familiarize themselves with other layer management tools in AutoCAD.
- This includes tools for freezing, thawing, and locking layers, enhancing overall control over drawing elements.
- Customizing Workspace for Efficiency:
- Designers can customize their AutoCAD workspace to optimize the placement of tool palettes and libraries for easy access during drag and drop actions.
- A well-organized workspace contributes to a more efficient and streamlined design process.
Conclusion:
In conclusion, AutoCAD’s drag and drop features play a pivotal role in enhancing the efficiency and intuitiveness of the design workflow. Whether inserting blocks, applying hatch patterns, reordering layers, or manipulating viewports, the drag and drop functionalities provide designers with a visually interactive and dynamic method for interacting with drawing elements. As AutoCAD continues to evolve, the emphasis on features like drag and drop reflects the software’s commitment to providing users with tools that transcend traditional drafting boundaries. Embrace the power of AutoCAD’s drag and drop features, and witness the transformation of your design experience into a journey of fluidity, efficiency, and creative exploration within the vast landscape of CAD design.