Tracking inventory in QuickBooks is essential for businesses that sell products, ensuring accurate stock management, cost of goods sold (COGS) calculations, and financial reporting. Here’s a detailed guide on how to track inventory in QuickBooks Online:
Introduction to Inventory Tracking in QuickBooks
- Importance of Inventory Management
- Understanding the significance of tracking inventory for business operations
- Benefits of using QuickBooks Online for inventory tracking and management
- Setting Up Inventory Features
a. Enabling Inventory Tracking
- Enabling inventory tracking in QuickBooks Online settings
- Choosing the appropriate inventory tracking method (FIFO, Average Cost, Specific Identification)
b. Adding Inventory Items
- Creating inventory items in QuickBooks Online
- Entering details such as item name, description, SKU, and sales price
Managing Inventory Items
- Adding Inventory Items
a. Manual Entry
- Adding inventory items manually into QuickBooks Online
- Specifying initial quantities and cost information
b. Importing Inventory Data
- Importing inventory data from spreadsheets or other sources
- Streamlining bulk additions of inventory items for efficiency
- Categorizing Inventory
a. Assigning Categories and Subcategories
- Categorizing inventory items by type, brand, or department
- Organizing inventory for easier tracking and reporting
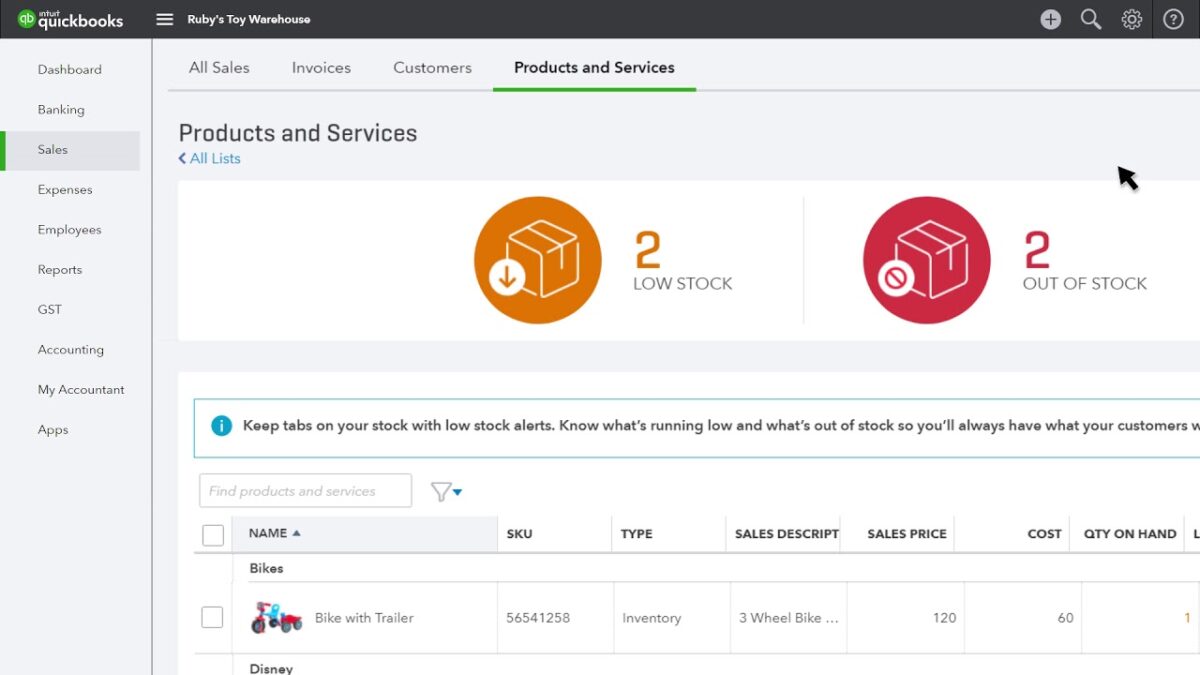
b. Setting Reorder Points
- Establishing reorder points for inventory items based on sales forecasts or historical data
- Automating alerts for low-stock items to avoid stockouts
Purchasing and Receiving Inventory
- Recording Purchases
a. Entering Purchase Orders
- Creating purchase orders in QuickBooks Online
- Specifying vendor details, quantities, and expected delivery dates
b. Receiving Inventory
- Recording inventory receipts upon delivery
- Verifying quantities and costs against purchase orders
Selling Inventory
- Creating Sales Transactions
a. Generating Sales Orders
- Creating sales orders to reserve inventory for customers
- Converting sales orders into invoices upon shipment or delivery
b. Invoicing and Sales Receipts
- Generating invoices or sales receipts for completed sales transactions
- Deducting sold inventory from available stock automatically
Inventory Adjustments and Transfers
- Handling Adjustments
a. Recording Inventory Adjustments
- Making adjustments for damaged, lost, or stolen inventory
- Updating inventory quantities and costs accordingly
b. Transferring Inventory
- Transferring inventory between locations or warehouses
- Recording inter-location transfers to maintain accurate stock levels
Inventory Reporting and Analysis
- Generating Inventory Reports
a. Running Inventory Valuation Reports
- Generating reports on inventory valuation (e.g., inventory stock status, valuation summary)
- Analyzing inventory turnover and cost of goods sold (COGS) trends
b. Forecasting and Planning
- Forecasting inventory needs based on sales projections and historical data
- Planning inventory purchases and stock replenishments strategically
Integration and Automation
- Integrating with E-commerce Platforms
a. Syncing Inventory Data
- Integrating QuickBooks Online with e-commerce platforms for seamless inventory management
- Syncing real-time inventory updates and sales transactions
b. Automating Inventory Tasks
- Automating inventory replenishment based on preset triggers (e.g., minimum stock levels)
- Streamlining inventory workflows to reduce manual effort and errors
Compliance and Audit Trails
- Maintaining Compliance
a. Compliance with Regulations – Ensuring compliance with inventory accounting standards (e.g., GAAP) – Auditing inventory transactions and maintaining accurate records
Conclusion
Effective inventory tracking in QuickBooks Online empowers businesses to optimize stock levels, streamline operations, and enhance financial decision-making. By following this comprehensive guide, users can leverage QuickBooks Online’s inventory management tools to maintain accurate inventory records, monitor stock movements, and drive business growth.