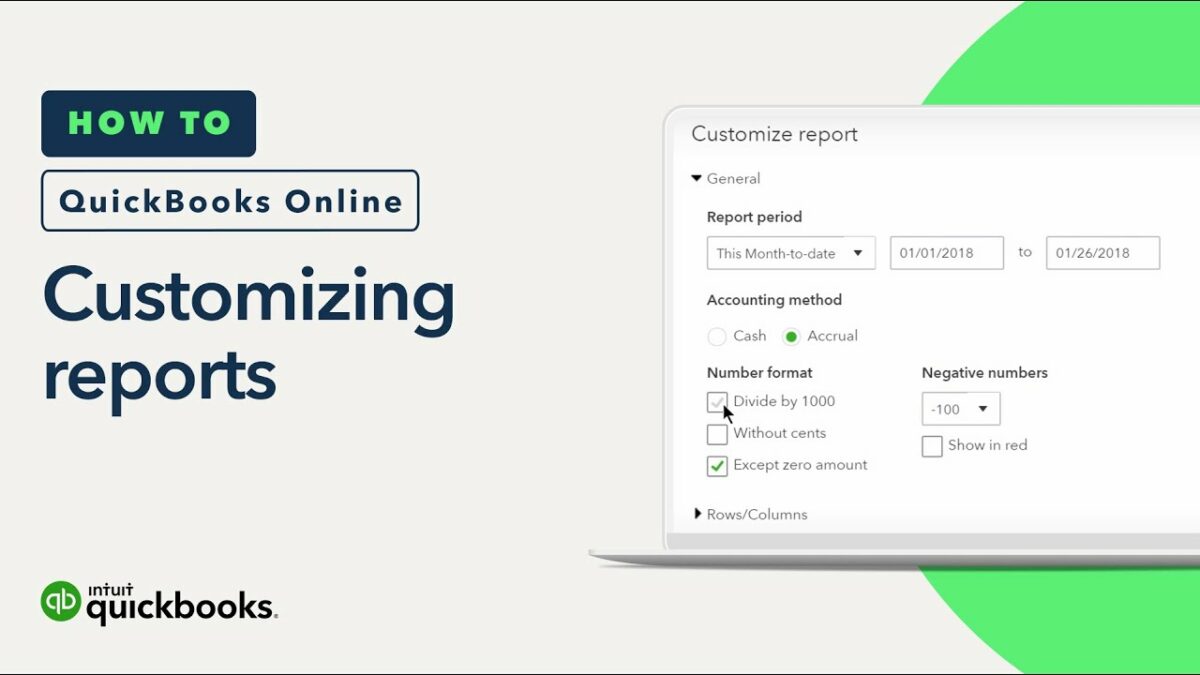
Customizing reports in QuickBooks allows businesses to tailor financial insights to their specific needs, improving decision-making and analysis capabilities. Here’s a comprehensive guide on how to customize reports in QuickBooks Online:
Introduction to Customizing Reports in QuickBooks
- Importance of Custom Reports
- Understanding the role of customized reports in business analysis
- Benefits of using QuickBooks Online for report customization
- Accessing Report Center
a. Navigating to Reports
- Logging into QuickBooks Online
- Accessing the Reports tab or Report Center
- Exploring various report categories and templates available
b. Choosing a Report
- Selecting a report template based on specific financial metrics or business needs
- Identifying the purpose and audience for the customized report
Basic Report Customization
- Customizing Report Headers and Footers
a. Modifying Report Titles
- Editing report titles and subtitles for clarity and relevance
- Adding company logo or custom headers for branding
b. Including Report Dates
- Setting report date ranges (e.g., custom date range, current fiscal year)
- Adjusting report period for accurate financial analysis
- Selecting Report Columns and Rows
a. Choosing Data Columns
- Selecting data columns to display specific information (e.g., amounts, percentages)
- Adding or removing columns to focus on key performance indicators (KPIs)
b. Grouping and Sorting Data
- Grouping data by categories (e.g., customers, products) for comparative analysis
- Sorting data in ascending or descending order based on criteria
- Applying Filters
a. Filtering Data
- Applying filters to include or exclude specific transactions or accounts
- Filtering by transaction type, customer, vendor, or other criteria
b. Saving Customized Views
- Saving customized report settings as favorites for quick access
- Creating and managing multiple report configurations for different purposes
Advanced Report Customization
- Adding Custom Fields and Formulas
a. Customizing Fields
- Adding custom fields to reports to include additional information or calculations
- Incorporating formulas for custom metrics or performance ratios
b. Using Advanced Filters
- Applying complex filters using multiple criteria and logical operators
- Fine-tuning data selection for detailed analysis and insights
- Formatting and Appearance
a. Customizing Fonts and Colors
- Changing font styles, sizes, and colors for enhanced readability
- Highlighting critical data points or trends with color-coded formatting
b. Including Graphs and Charts
- Incorporating graphs, charts, or visual representations of data in reports
- Visualizing trends and comparisons to facilitate data interpretation
Sharing and Exporting Reports
- Exporting Reports
a. Saving Reports as PDF or Excel
- Exporting customized reports in PDF or Excel formats for sharing or printing
- Sending reports via email directly from QuickBooks Online
b. Scheduling Reports
- Setting up automatic report schedules for regular distribution
- Automating report delivery to stakeholders or team members
Advanced Reporting Features
- Drilling Down into Details
a. Drill-Down Capability
- Accessing detailed transaction-level data from summary reports
- Investigating specific transactions or discrepancies for in-depth analysis
- Integration and Data Sync
a. Integrating with Third-Party Apps – Connecting QuickBooks Online with external reporting tools or business applications – Syncing data for comprehensive financial reporting and analysis
Conclusion
Customizing reports in QuickBooks Online empowers businesses to tailor financial insights, improve decision-making, and monitor key performance indicators effectively. By following this comprehensive guide, users can leverage QuickBooks Online’s robust reporting capabilities to gain actionable insights and drive business growth.
