In the realm of database management, the true value of data often lies in its ability to be transformed into meaningful insights. Microsoft Access 2016, a robust and feature-rich database management system, offers a suite of powerful reporting tools that redefine the way users extract, analyze, and present information. This comprehensive guide delves into the intricacies of Reporting Redefined, exploring the reporting tools within MS Access 2016, their functionalities, and how they empower users to create compelling and insightful reports.
The Significance of Reporting in Database Management
Reporting serves as the gateway to turning raw data into actionable insights. In the context of database management, reporting is the process of organizing, summarizing, and presenting data in a visually appealing and comprehensible format. Effective reporting allows users to glean valuable information, make informed decisions, and communicate findings to stakeholders. In MS Access 2016, reporting goes beyond mere data display, offering a dynamic and customizable platform to showcase information.
Core Reporting Tools in MS Access 2016
1. Report Design View:
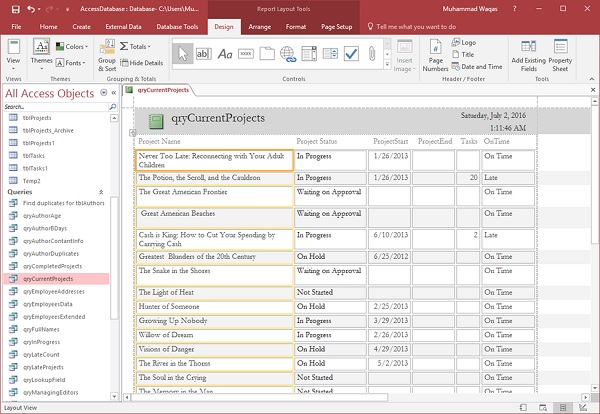
- The Report Design View is the canvas where users design the layout and structure of their reports. It provides a visual interface for adding elements such as tables, queries, fields, and controls to create a customized report.
2. Report Wizard:
- The Report Wizard is a user-friendly tool that guides users through the process of creating a report. It prompts users to select tables or queries, choose fields, and defines grouping and sorting options to generate a report quickly.
3. Layout View:
- The Layout View offers a live, interactive preview of the report as it is being designed. Users can make real-time adjustments to the layout, size, and positioning of report elements for a more intuitive design experience.
4. Sorting and Grouping:
- MS Access 2016 allows users to organize data in reports through sorting and grouping options. This feature is instrumental in presenting data hierarchies and summarizing information based on specific criteria.
5. Report Controls:
- Report Controls, such as text boxes, labels, and images, can be added to reports to enhance their visual appeal. These controls provide a means to include additional information, headers, footers, and images within the report.
Creating Reports in MS Access 2016: A Step-by-Step Guide
Step 1: Open the Database:
- Launch MS Access 2016 and open the database containing the data you want to report on.
Step 2: Select Report Wizard or Design View:
- Choose between using the Report Wizard for a guided approach or the Report Design View for more control over the report’s layout and structure.
Step 3: Choose Data Source:
- If using the Report Wizard, select the table or query that will serve as the data source for the report. Define grouping and sorting options as prompted.
Step 4: Design the Report:
- In the Report Design View or Wizard, design the report by adding fields, controls, headers, footers, and any other elements needed to convey the information effectively.
Step 5: Apply Sorting and Grouping:
- Utilize the sorting and grouping options to organize data within the report. This is particularly useful for creating summary reports or reports with hierarchical structures.
Step 6: Preview and Adjust:
- Preview the report to see how it will appear when printed or viewed. Make adjustments to the layout, formatting, or design as needed.
Step 7: Save and Share:
- Save the report for future use and share it with others as needed. Reports can be exported to various formats, including PDF and Excel, for broader distribution.
Types of Reports in MS Access 2016
1. Detail Reports:
- Detail reports present data in a detailed, itemized fashion. Each record in the report is displayed individually, providing a comprehensive view of the dataset.
2. Summary Reports:
- Summary reports aggregate and summarize data, often incorporating totals, averages, or other calculated values. They are useful for presenting an overview of key metrics.
3. Grouped Reports:
- Grouped reports organize data into groups based on specific criteria. Each group is accompanied by subtotals or other summary information, offering a structured view of the data.
4. Mailing Label Reports:
- Mailing label reports are specialized reports designed for printing mailing labels. They allow users to format and arrange addresses for mail merges and mass mailings.
5. Chart Reports:
- MS Access 2016 enables the creation of reports with embedded charts. These reports visually represent data using various chart types, enhancing the interpretability of information.
Advanced Reporting Features and Functionalities
1. Conditional Formatting:
- Conditional formatting allows users to apply formatting rules based on specific conditions. This feature enhances the visual appeal of reports and draws attention to critical information.
2. Subreports:
- Subreports are reports embedded within other reports. They are useful for presenting related information or breaking down complex datasets into more manageable components.
3. Parameter Queries:
- Reports can be linked to parameter queries, allowing users to input specific criteria when running the report. This enhances the flexibility and adaptability of reports to varying requirements.
4. Drill-Down Reports:
- Drill-down reports provide an interactive experience where users can click on elements within the report to access more detailed information. This is valuable for exploring data at different levels of granularity.
5. Exporting and Printing Options:
- MS Access 2016 offers a range of options for exporting and printing reports. Users can export reports to PDF, Excel, or other formats for sharing, and they can customize printing settings for optimal presentation.
Real-World Applications of MS Access 2016 Reports
1. Financial Reports:
- MS Access reports are instrumental in creating financial statements, budget reports, and profit-and-loss statements. Summary reports can showcase key financial metrics, while detail reports provide a granular view of transactions.
2. Sales and Marketing Reports:
- Sales reports can summarize sales performance by region, product, or time period. Marketing reports can showcase campaign effectiveness, lead generation, and customer acquisition metrics.
3. Inventory and Supply Chain Reports:
- Inventory reports help monitor stock levels, track item movements, and analyze inventory turnover. Supply chain reports provide insights into the efficiency and reliability of the supply chain processes.
4. Employee Performance Reports:
- HR departments can leverage reports to evaluate employee performance, track training progress, and analyze workforce demographics. Grouped reports can showcase performance metrics by department or team.
5. Project Management Reports:
- Project managers can utilize reports to monitor project progress, track milestones, and analyze resource utilization. Drill-down reports can provide detailed insights into specific project phases or tasks.
Best Practices for Report Design Mastery
1. Understand the Audience:
- Tailor reports to the needs and preferences of the intended audience. Consider the level of detail, formatting preferences, and specific information that stakeholders find valuable.
2. Consistent Design Elements:
- Maintain consistency in design elements across reports. This includes using the same fonts, colors, and formatting styles to create a cohesive and professional appearance.
3. Optimize for Readability:
- Prioritize readability by choosing legible fonts, appropriate font sizes, and clear contrasts between text and background colors. Organize information logically to guide readers through the report.
4. Include Visual Elements Sparingly:
- While charts and images can enhance reports, use them sparingly and purposefully. Visual elements should support the narrative of the report without overwhelming the reader.
5. Regularly Review and Update Reports:
- As data and reporting requirements evolve, regularly review and update reports to ensure they remain relevant and aligned with the goals of the organization. This may involve adding new fields, adjusting layouts, or incorporating new data sources.
Conclusion
Reporting Redefined in MS Access 2016 is not just a feature; it is a transformative approach to data presentation and analysis. This comprehensive guide has navigated the reporting landscape within MS Access, from core tools to advanced features, showcasing their collective ability to redefine the way users interact with and derive insights from their data.
As users harness the reporting tools of MS Access 2016, they unlock a realm of possibilities to communicate data-driven narratives, make informed decisions, and present information in a compelling and accessible manner. Beyond the traditional boundaries of data storage, MS Access reports become the conduit through which information becomes knowledge, enabling users to elevate their understanding of their datasets and share meaningful insights with stakeholders. In the dynamic landscape of database management, Reporting Redefined in MS Access 2016 stands as a beacon of clarity, turning the vast sea of data into a navigable path toward informed decision-making and organizational success.